Jim Parker specialises in building energy modelling and the urban environment. He has been involved in a broad range of research projects, including detailed modelling of domestic and non-domestic buildings, in both retrofit and new-build scenarios. His work has also expanded to cover environmental monitoring in urban environments, with a particular focus on urban heat islands, air quality and the impact of urban green space.
Jim’s research has included extensive work on the calibration of energy and thermal models, an area of expertise that informs in-depth evaluation of retrofit measures.
In addition to his work in the retrofit sector, Jim has been involved in projects that have developed offsite manufacture systems for low energy buildings, overheating mitigation in future climate scenarios, energy management systems in the non-domestic sector, performance analysis of district heating systems and green infrastructure deployment in urban environments.

1. How can you relate your work activities to urban greening?
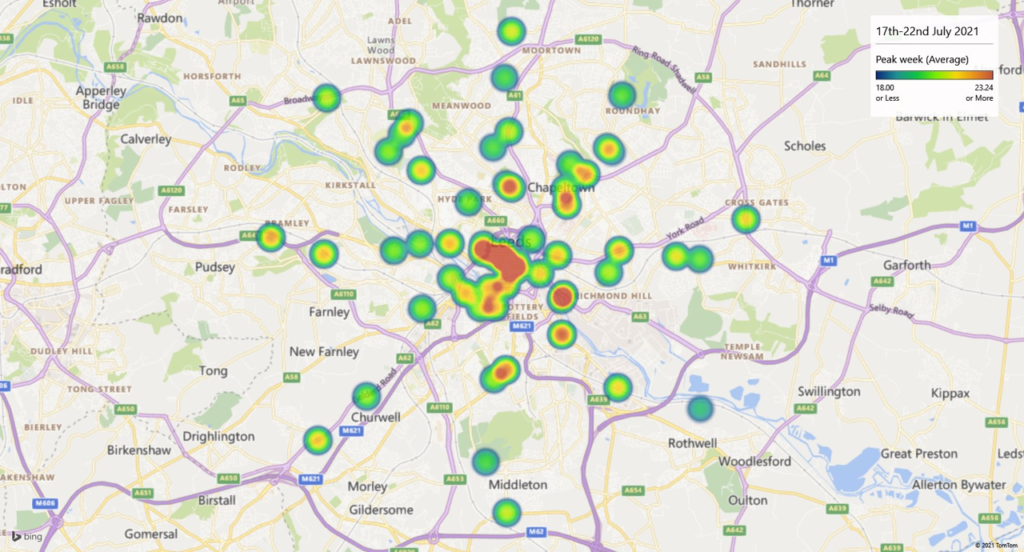
At the Leeds Sustainability Institute at Leeds Beckett University, we have a number of ongoing research projects that aim to quantify the impact of green infrastructure in our urban environment. We have approximately 70 sensors installed across the city region measuring air temperature and relative humidity in both grey and green spaces. The main aim is to understand the impact of greening in the context of the Urban Heat Island. We also have 5 high resolution air quality sensors in city and semi-urban locations which we also use to try and understand the impact of green space on pollutant levels; this network is being extended to include 2 more sensors in 2021.
2. What do you think are the key factors for a good human-nature relationship? How can urban greening contribute as much as possible to this?
Our research is mainly quantitative in nature and I feel strongly that we need robust data on urban greening to help influence decision makers in local authorities and business leaders. Whilst there is a lot of good quality research that helps us to understand the social and health related benefits of green space in our cities, we hope that adding high resolution quantitative data to this can help to create stronger cases for the retention and introduction of urban greening in the future.
3. In which aspects would you like to see change in this in the short and long term?
I’d love to see more long-term studies of urban greening that measure environmental conditions before and after greening is introduced; we have completed lots of quantitative studies on building energy retrofit projects and it would be fantastic to see the same sort of studies completed for urban greening. This isn’t always easy to do due to the stakeholders involved and the cost of collecting data long-term; it is
possible though and would help to support investment in green infrastructure.
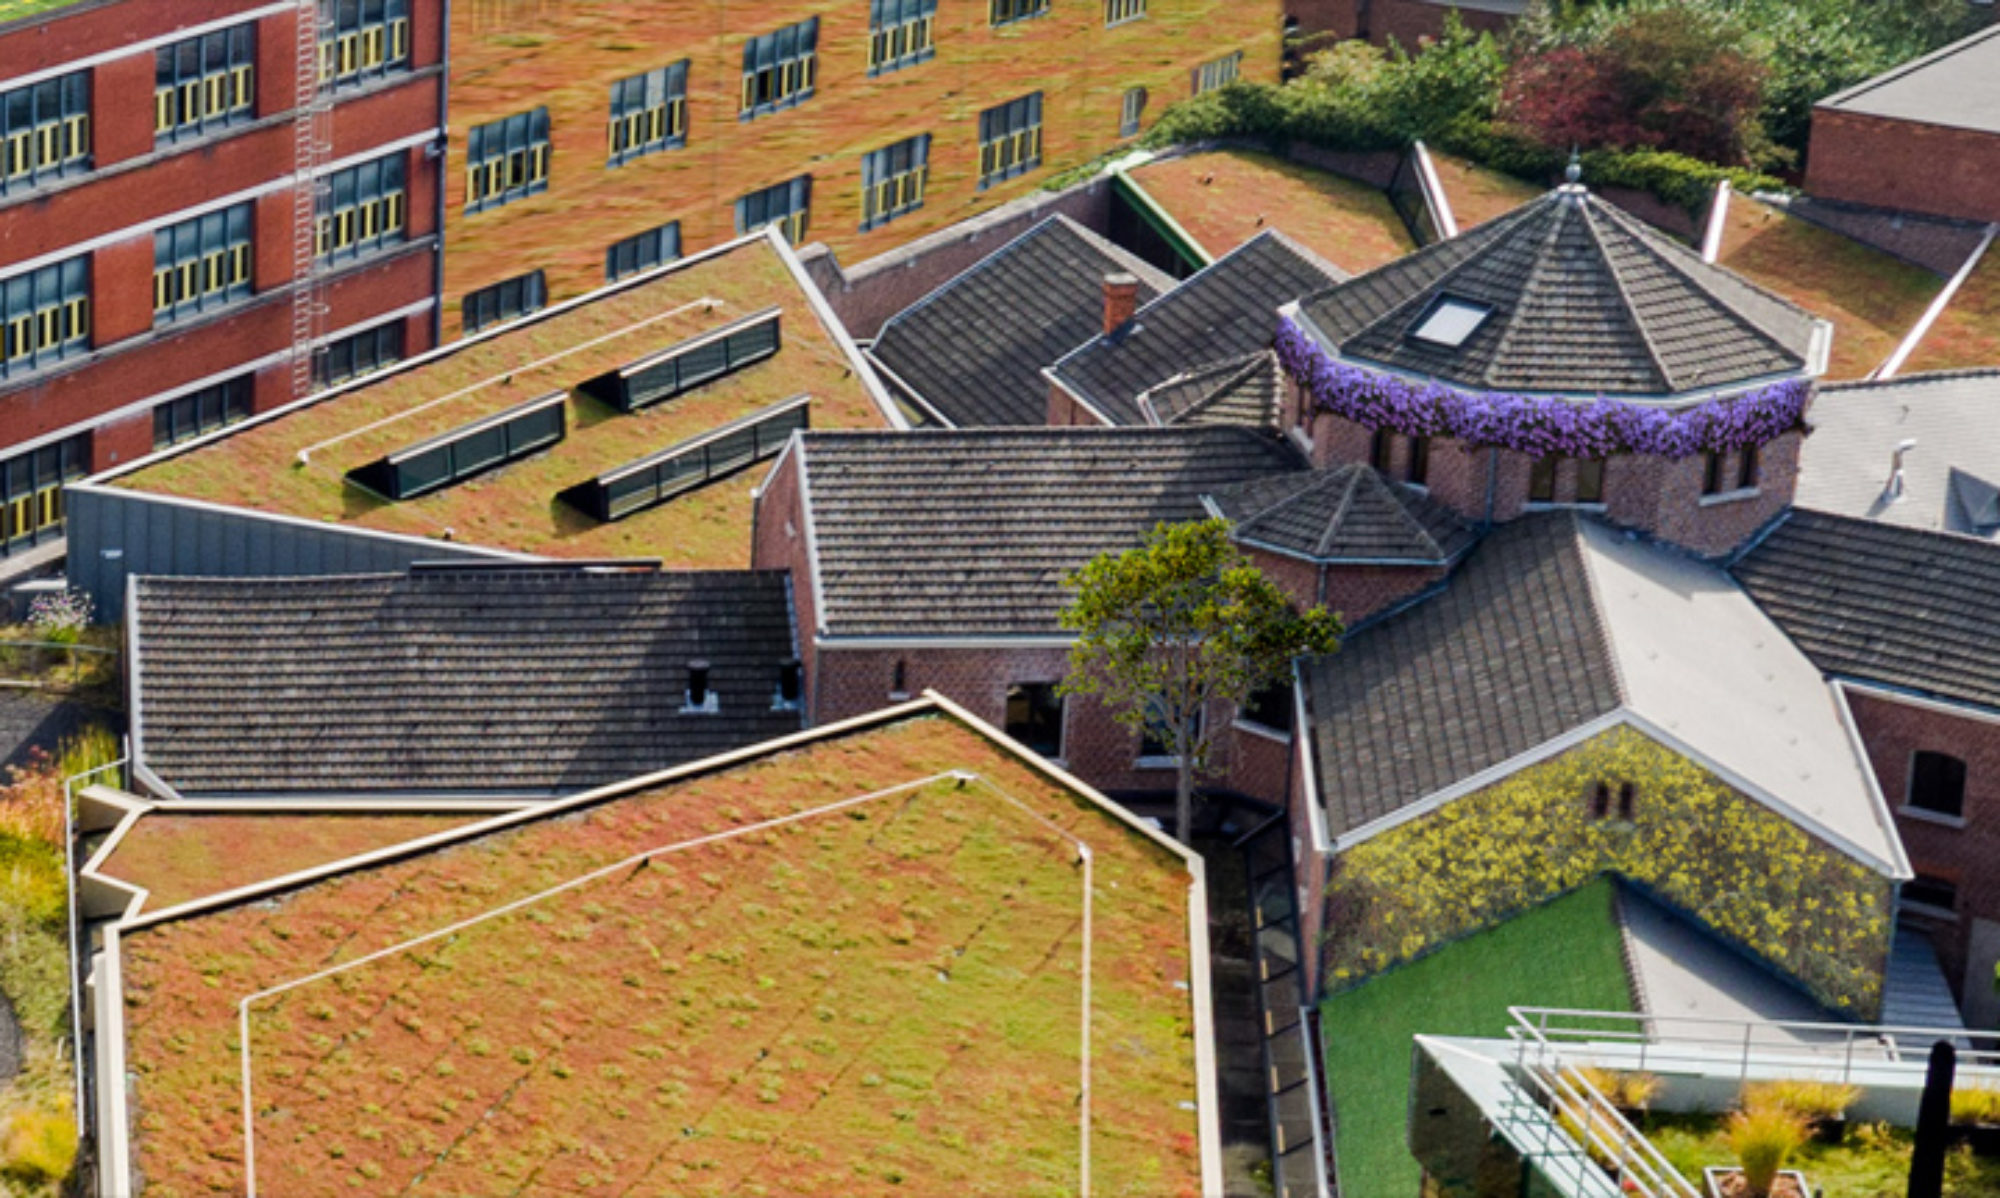
4. What advantages do green roofs and facades offer compared to other Nature Based Solutions in city’s like parks or urban gardens?
They perhaps provide a more financially viable solution in the context of the high land-value in city centres. The opportunity to retrofit these to existing buildings will occur much more frequently than the opportunity to replace grey space with green.
5. How do you see the future?
Hopefully it’s obvious from my previous responses that I’d like to see more environmental monitoring of urban greening, and for this to further inform planning and investment decisions. I’m encouraged by the continuing recognition of the multiple benefits that green infrastructure can bring in urban environments. I also like the idea of green and blue corridors beginning to create stronger links between urban areas and the surrounding countryside, both in a biodiversity context but also as a healthy resource for urban citizens.